

Published on Nov 30, 2023
Karnataka’s coastline extends over a length of 320 kilometers along the west coast of India from Mangalore to Karwar. The Karnataka coastal region lying between the edge of Western Ghats and the Arabian Sea covers Dakshina Kannada, Udupi and Uttara Kannada districts. It has difficult terrain full of rivers, creeks, cliffs, sand dunes, waterfalls, peaks, long beaches and hill ranges. The important estuaries in the area are Aghanashini, Gangavali and Kalinadi estuaries. Along the Karnataka coast 75% of the coastline is covered with sandy beaches (Kumar et al.,2006). The intertidal zone of sandy beaches is a highly dynamical zone caused by natural (tide, wave and wind) as well as human activities (Short and Hesp, 1982; Niedoroda et al., 1984; Wright and Short, 1984; Larson et al., 2000; Capo et al., 2006; Scott et al., 2011; Van Rijn,2011). Seasonal variations of beach erosion and/or accretion and also spatio-temporal evolution of beach profiles provides useful information for the scientific understanding of coastal processes and management (Andrade and Ferreira, 2006; Gujar et al., 2011).
Keywords : Beach Profile, CM plot, Linear Discrimination Function
The beach profile gets altered depending on the balance between physical agencies and the supply of material from the inland water. Large scale irreversible transformations, however, would lead to deformations in the shoreline configuration. Which give rise to the different geomorphic processes such as erosion, deposition, sedimentation, periodic storms, flooding and sea level changes etc. keeping this in mind following objectives are set for the present study.
1. To Understand the Direction and magnitude of littoral drift
2. Textural parameters of the sediment.
3. To understand the presence of heavy minerals.
4. Suggestion of Sea wall along most vulnerable location.
5. Impact of anthropogenic activities on beach morphology if any.
Before commencing the study, primary visit is conducted to fix up the stations points (Figure 1), while selecting the stations points care was taken that they should not be disturb for the study period. Beach profiles were measured using Auto level from reference points to low water line at selected stations representing entire beach, during low tide period. Survey is conducted for the period of five months during premonsoon period of 2016 (January to May) during first week of the every month. From the profile data, volume of sediment eroded or accreted at the five stations is computed by superimposed profile. Observations on waves (height and period) and longshore currents (speed and directions) were also made visually using a graduated pole, measuring tape and Rhodomine-B dye.
During the beach profile survey at every five meter, top 4cm sediment samples are collected are they are subjected to preliminary analysis (coning-quartering, washing, treated with chemicals to remove carbonate shells, iron coating and organic matter) and textural analysis (sieve analysis using Ro-Tap Sieve Shaker). The grain size data (weight %, Cum. weight %) obtained were then used in GRADISAT software for textural parameters (Mean size, standard deviation, skewness and Kurtosis) of Friedman (1961) and Folk and Ward (1957). These textural parameters were used for various univariant and bivariant plots to delineate the depositional environment and sediment movement along the stretch. Also using the application of remote sensing, erosion and deposition of the soil is determined by ERDAS software.
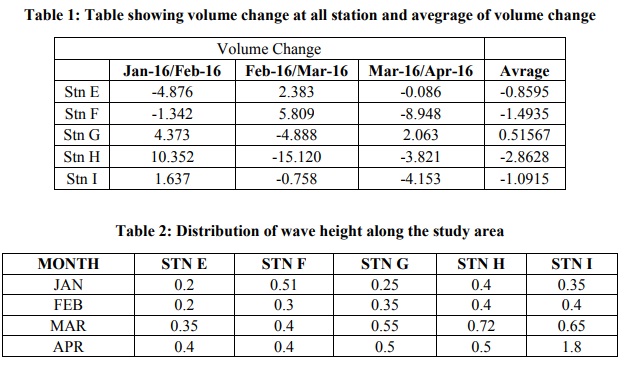
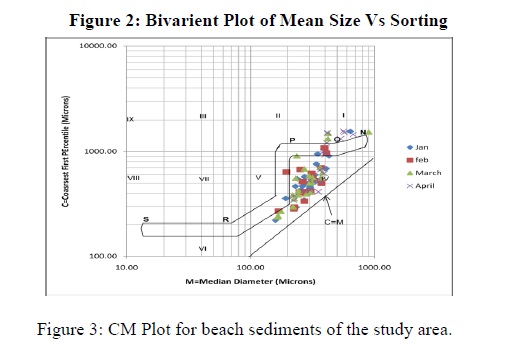
Form the various analysis and experiments, it has been revealed that the dominant process over the study area is erosion which is being prominent at station H, thus this station is considered as more affected station and we suggest the construction of seawall at this place. From the textural analysis, it reveals that the sediments follow the general trend of deposition and addition of fine sediments is taking place near to the shore line. Also it has been understood that mean size is decreasing towards the stations I and that of sorting increases, thus the sediment movement is towards the north portion of the beach i.e. Station I. (Figure 2). Also Heavy minerals are deposited at station G and H indicating the presence of high energy conditions at these points.
From CM plot (Figure 3), it reveals that sediments are transported under graded suspension and deposited under high energy conditions. Also linear discriminate function (Figure 4) explains that sediments are transported under Aeolian conditions and deposited under the shallow agitated water supporting the results of CM plot.
From the remote sensing study it has been observed that erosion was the dominant process for the period of 2000 - 2005 while deposition for the period 2005 - 2010. (Figure 5) This change took place because of initiation taken by the port department to construct the seawall along the study area during 2005-06.
Present study is just an attempt to show the process of erosion and deposition along with a littoral and cross shore variations along the beach. Results presented in the report are for the period of four months (Premonsson) which is generally considered as a period of erosion (Hanamgond, 1992). Thus, the detailed investigation throughout the year/s is required to conclude about the dominant process among erosion and deposition and direction, magnitude of littoral drift.
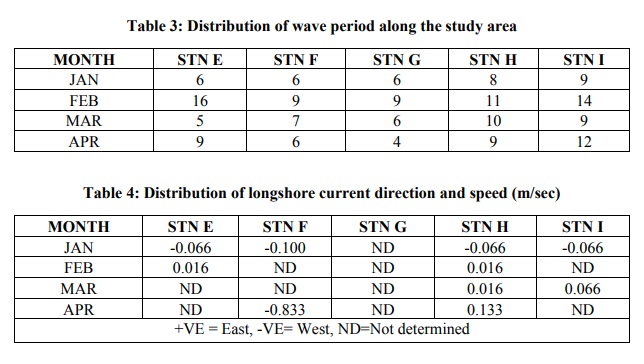
Observations on wave parameters (height and period) and long-shore currents (velocity and directions) are also made visually using a graduated pole, measuring tape and Rhodomine-B dye.
The wave height is measured by taking the average of the heights of all the waves, above a datum, in the duration of one minute. It is measured in centimeter. The wave period is measured by calculating number of waves passing over an abruptly fixed point in a period of one minute. It is measured as number of waves per minute.
Wave velocity and direction: Speed at which the individual WAVE form advances is called wave velocity. It is determined by pouring the Rhodomine-B dye at a point in the sea and noting the distance it traveled in the interval of one minute and the direction in which it travels gives us the wave direction.
During the beach profile survey, at every ten meters, top 4cm sediment samples (approx 300gm) are collected and subjected to preliminary analysis which includes coningquartering, washing and treatment with chemicals to remove carbonate shells, iron coating and organic matter. The samples are dried at room temperature and then coning and quartering is done to get a through mixture. 50 gm of the each sample will be washed and dried. Washing is carried out by first washing the samples twice with water to remove dry leaves and twigs, if any. Later the samples are washed with dilute HCL to dissolve the shells and other calcious substance and also to prevent stickiness of the sediments during sieve analysis. Then the samples are again washed twice with water. These samples are then subjected to heating. The samples are first heated with oxalic acid till high effervescence is formed which indicates the removal of halogens; sulfates etc. Later on the Samples are heated with hydrogen peroxide to remove organic matter. The heated samples are again washed twice with water. The washed samples are then dried in oven at 100°c for an hour. The washed and dried samples are then subjected to textural analysis.
The samples from all the stations are washed with various chemicals and dried in oven as mentioned above. These samples are then subjected to textural analysis i.e. sieves analysis using Ro-Tap Sieve Shaker. The grain size data (weight %, Cum. weight %) obtained are then used in GRADISAT software for textural parameters (Mean size, standard deviation, and skewness) of Friedman (1961) and Folk and Ward (1957). These textural parameters are used to plot various uni-variant and bi-variant graphs to delineate the depositional environment and sediment movement along the stretch.
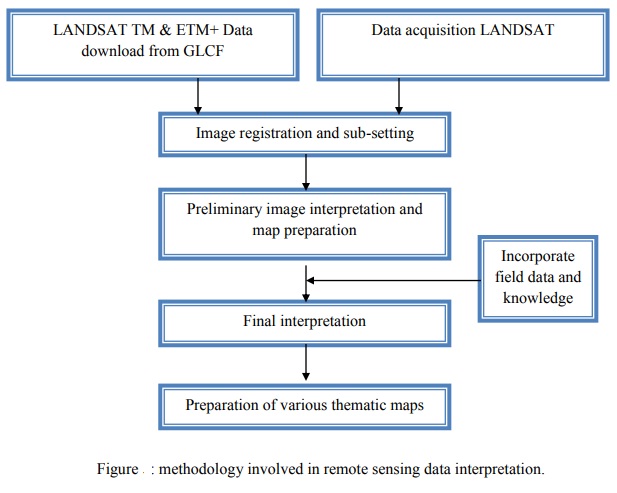
Subset of the study area where used for land use classification lineaments, beach ridges erosion and accretion along the study area using the standard remote sensing techniques, viz., using high-pass filters for image enhancement, supervised classification, image differencing etc.
For the erosion and accretion study, supervised classification of the subset images of the study area had been done with only two classes land and water with suitable values. They were subtracted using model maker to have erosion and accretion regions. The final output gave a pseudo color mode image that was modified by giving suitable colors to land, water, accretion and erosion. The number of pixels assigned to the erosion and accretion category was multiplied with the picture resolution (pixels) values to get the net erosion or accretion amount. Steps involved in utilization of remote sensing data are given in the figure.
Morphology of any given beach and its variation could be used as an index of the available energy along the shores and the complex interacting forces prevailing in the wave shoaling zone. Therefore to understand the impact of sedimentation on the morpho-dynamics of the beaches, the casual relationships over monthly, seasonal and annual scales, the present study was undertaken both in space and time. The study of volumetric change (erosion or accretion) of the beach (variation in sand level) with time and in turn the sediment movement was also undertaken. Five reference points or stations were fixed along the beach .Beach profile were monitored as mentioned in methodology. The details of morphological studies are described separately for all the five stations.
Present study is carried out to understand the morphometric changes in the study area. For this work every month second weekend from January 2016 to April 2016 is utilized for the field work. Where survey is conducted with the help of auto level form the fixed location to the seaward. Profiles of each fixed point is plotted is change in the profile is carried out by superimposing the previous profile with the present profile. From the above Discussion it has been revels that the dominant process over the study area is erosion. which is being prominent at station H thus the this station is considered as more effected station and we suggest the construction of seawall at these place. From the textural analysis it has been revels that’s the sediments follow the general trend of deposition and addition of fine sediments is taking place near to the shore line.
Also it has understood that mean size is decreasing towards the station and that of sorting increases thus the sediment movement is towards the north portion of the beach. Presence of heavy mineral has been observed along the station G and H, explaining about the high energy conditions along these stations. From CM plot it has revels that sediments are transported under graded suspension and deposited under high energy conditions. While linear discriminate function explains that sediments are transported under aeoline conditions and deposited under the shallow agitated water supporting the results of CM plot. From the remote sensing study it has been observed that erosion was the dominant process for the period of 2000 to 2005 while deposition for the period 2005 to 2010. This change took place because of initial taken by the port department to construct the seawall along the study area.
