


Published on Apr 02, 2024
• To experimentally determine the time constant (t) of a slow RC circuit and verify the value using the actual formula. • To calculate the maximum charge attained by the capacitor, i.e. the charge attained by it in steady state.
• To graphically represent the charging and discharging of the capacitor using the values obtained This project is based on the analysis of a simple RC circuit and how the voltages across its components vary with time. A resistor-capacitor circuit (RC circuit), or RC filter or RC network, is an electric circuit composed of resistors and capacitors driven by a voltage or current source. A first order RC circuit is composed of one resistor and one capacitor and is the simplest type of RC circuit.
In this project, the focus is on slow RC circuits, the ones in which charging and discharging of the capacitor take place in a notable amount of time. This makes it possible for the human eye to observe the changes in the voltage and derive results from the readings. The various technical terms and formulae have been explained in detail in the project's theory.
The project aims to experimentally determine the time constant of an RC circuit and verify the results with existing formulae. Using the values obtained, the maximum charge on the capacitor shall be determined and the capacitor's charging and discharging shall be represented graphically.Requirements
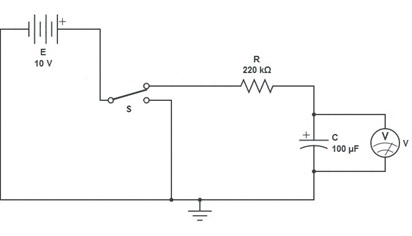
• A Battery Eliminator of 10 V
• An Electrolytic Capacitor of 100 m F
• A Carbon Resistor of 220 k W
• A Voltmeter
• A Two-Way Switch
• Connecting Wires
• Stopwatch
• i. Obtain the components required for the circuit.
• ii. Clean the ends of the connecting wires with a sand paper.
• Connect the +ve terminal of the battery eliminator E to the common end of two way switch S.
• iv. Connect the -ve terminal of E to the shorter leg of the electrolytic capacitor C.
• v. Draw a wire from the one of the ends of S and join it to the above wire to form a junction.
• vi. Connect a wire from the capacitor side of this junction to ground ( 0 Volts ).
• Connect a wire from the longer leg of the capacitor to the resistor R.
• Connect the other end of R to the remaining end of S.
• ix. Connect the Voltmeter, V, in parallel across C to complete the circuit.
• x. To start the experiment, turn S to the upper position and switch on E. Wait till the voltmeter reaches a steady value. Note that this value will be equal to 10V, the voltage provided by E. When this happens, the capacitor is said to be in steady state.
• xi. Once the capacitor is fully charged, turn S to the lower position and start the stopwatch.
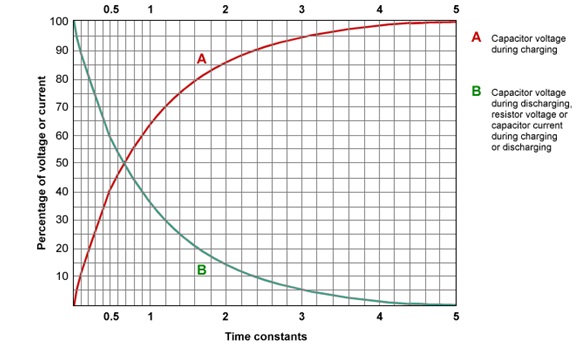
• As the capacitor discharges through ground, the reading in V1 reduces gradually. As the reading in V reaches a value of E (.368), stop the stopwatch and note its reading. This is the value of one time constant.
• Turn S to the upper position again and start the stopwatch.
• Note the time when V displays a voltage of E (.632). This is the value of one time constant taken while charging. Both the observed values should be about the same.
• Repeat discharging and charging three more times to get a total of 8 readings for the time constant. Note them in the observations table, and find their average to compute t.
• Calculate the theoretical value of t from RC and find the percentage error in computing the experimental t.
• To find the maximum value of charge stored in C, multiply the voltage observed at steady state with the capacitance.
• Find the percentage error again after calculating the actual value from CE.
• Repeat the charging and discharging processes to obtain the voltage values at 6 different time values for each.
• Plot these on graph paper. Graph
i. Take two graph sheets and mark voltage (in volts) along the y-axis, and time (in seconds) along the x-axis.
ii. Plot the readings under charging in one and discharging on the other.
iii. Join the plotted points with a smooth freehand curve.
iv. Both the graphs should be exponential in nature.
1. Within Experimental Limits the Time Constant of the given slow RC circuit has been determined as …………. s, with a percentage experimental error of ……………. .
2. The Maximum Charge on the Capacitor has been determined as …………… C.
3. The charging and discharging of the capacitor were represented graphically and both the graphs turned out to be exponential in nature.
• The insulation from the ends of the connecting wires must be removed properly and the ends must be cleaned with sandpaper.
• All connections must be ensured to be tight.
• Readings involving the use of a stopwatch must be taken carefully and accurately.
• The polarities of all equipment used must be taken into account while connecting the circuit.
• The Voltmeter must be connected in parallel across the Capacitor.
