

Published on Nov 30, 2023
Drought is an insidious hazard of nature which is considered by many to be the most complex but least understood of all natural hazards. It is among the natural disaster that causes damages and affects many people’s life in many part of the world. Drought can be divided into four categories of meteorological, hydrological, agricultural and social-economic. Drought vulnerability is a concept which shows the likelihood of damages from hazard in a particular place by focusing on the system status prior to the disaster. Drought vulnerability has been viewed as a potential for losses in the region due to water deficiency at the time of drought. In this study the vulnerability of drought in Ramanagara district in Karnataka State is investigated by providing vulnerability maps which demonstrates spatial characteristics of drought vulnerability.Modern technology has made substantial contribution in the identification of drought vulnerable area. The modern technology used in present system for drought prone area identification is remote sensing and geographic information system.
Drought is one of the climatic, natural disasters, having an impact on both the economy and the society, with its long-standing problems. Drought by nature is a result of inter-related parameters. The study is based on the concept that the severity of the drought is a function of rainfall, hydrological and physical aspects of the landscape, leading to meteorological, agricultural drought. In the present study a Geographic Information Systems (GIS) and remote sensing -based tool for drought vulnerability assessment at a micro level has been developed. The result of this study can be used for preparedness planning and for allocating resources for facing droughts in this region.
Keywords : Drought, Geographic Information System, Remote Sensing, Ramanagara, assessment Maps.
Identify areas facing severity of drought condition at various levels by preparing agricultural drought risk zone map and meteorological drought risk zone maps using remote sensing and GIS.
To analyse changes in vegetation cover due to variation in rainfall. (By using rainfall data and NDVI images of past 10 years.
Identify direct consequences of the drought, such as reduced crop yields, livestock losses, and reservoir depletion that helps to monitor real time situation in the future for different adaptation options.
Identify mitigation actions to address vulnerabilities and reduce impacts .
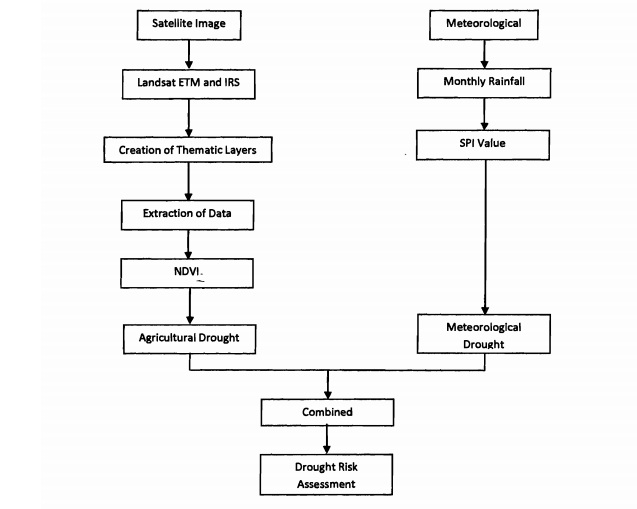
It includes extraction of satellite images, and extraction of data from images and Calculating the Normalized Difference in Vegetation Index values and Comparing with Standard NDVI values, collection of Rainfall data and calculation of Standardized Precipitation Index (SPI) values with Standard Values and generating the SPI maps and analysing the areas which are affected by Drought.
Similar kind of study can be carried out for the other Districts, (Taluks wise) of Karnataka such as Gulbarga, Kolar,Bagalkote, Raichur etc.
Drought Atlas can be prepared for the entire Ramanagara District.
From the analysis, it is concluded that,
1. Magadi taluk have been identified as severe drought areas from the total geographical area of the study and Ramanagara and Kanakapura taluk have mild drought.
2. GIS and RS has been used to arrive NDVI, SPI values. This data can be used for further planning of the region and will help in disaster management and crop management
3. The Kharif and Rabi crops can be appropriately distributed to effectively utilize the resources available and will reduce the losses incurred by farmers.
