

Published on Nov 30, 2023
In order to ensure the safe supply of the drinking water quality needs to be monitored in real time. Here, we present the design and development of a low cost system for real time monitoring of water quality in IOT (internet of things). The system consists of several sensors which are used to measure the physical and chemical parameters of water such as temperature, pH, turbidity and conductivity. The measured values from the sensors ae processed by the core controller. The Arduino model is used as a core controller. The design system applies a specialized IoT module for accessing sensor data from core controller to the cloud. The sensor data can be viewed on the cloud using a special IP address. Additionally the IOT module also uses an SMTP protocol for viewing the data in pdf format.
Keywords: - pH sensor, Turbidity sensor, Temperature sensor, Conductivity sensor, Arduino Uno model, IoT, Water Quality Monitoring.
Water is a valuable and finite resource on Earth. Both water quantity and quality are becoming dominant issues in many countries. European Environment Agency notes that except in some northern countries that possess abundant water resources, water scarcity occurs in many countries, particularly in the Mediterranean, Middle East, Africa etc, confronted with a crucial combination of a severe lack of and high demand for water. The growth of world population, up to 9 billion by 2050, leading to increase demands of water, growing urbanization and high living standards, intensive agricultural activities and industrial demands as well as climate change with droughts and floods episodes are significant pressures for the available water resources. Consequently, many countries have significant problems concerning both severe water scarcity and poor water quality. Surface water and groundwater that are the main sources of fresh water for drinking purposes, irrigation and various other uses, represent as small fraction of water burden on earth. It is pointed out that only 30% of the freshwater (3% of the total volume of water) on Earth is groundwater. In many areas, water needs are mainly covered by groundwater abstracted from the aquifers via numerous wells and boreholes. As a result, a negative water balance is established in the aquifer systems around the world and water levels are dropping rapidly.
It is a well-known fact that pure water is absolutely essential for healthy living. Adequate supply of pure and clean drinking water is a basic need for all human beings on the earth, yet it has been observed that millions of people worldwide are deprived of this. Water resources all over the world are threatened not only by over exploitation but also by ecological degradation. The main source of water pollution can be attributed to discharge of untreated waste, dumping of industrial effluent, and run-off from agricultural fields. Industrial growth, urbanization and the increasing use of synthetic organic substances have serious and adverse impacts on water bodies. It is a generally accepted fact that the developed countries suffer from problems of chemical discharge into the water sources mainly groundwater, while developing countries face problems of agricultural run-off in water sources. Contaminated drinking water causes problem to health and leads to water-borne diseases.
1. Our system reduces time consumed in testing – Collection of samples from various locations and finally bringing the samples to laboratory for testing.
2. Reduction in man power involved in collection and testing of water samples.
3. It minimizes the time required for testing the quality of water.
4. Testing of water is done at the source itself using portable system and can be done in seconds.
5. This system removes the need of laboratory testing.
6. Test results are recorded in cloud so that any previous data of testing can be fetched easily
7. Test results are sent to emails, so that required action on distribution of water can be taken by the owner
8. If necessary action is not taken in the stipulated time, the details will be uploaded in social media website, so that the common people will be aware that contaminated water is being supplied.
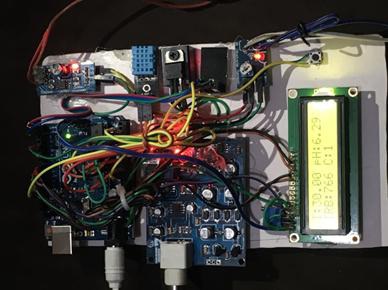
The whole design of the system is based mainly on IoT. There are basically two parts included, the first one is hardware and the second one is software. The hardware part has sensors such as temperature sensor, pH sensor, turbidity sensor and conductivity sensor which help to measure the real time values, along with Arduino Uno microcontroller, ESP-8266 Wi-Fi module and LCD screen. Each sensor is dipped in the water sample. The values read by these sensors are analog and continuous. Each sensor has its own comparator which acts as a communication medium between the sensor and the microcontroller. Since these values are analog, the Analog-to-Digital Converter(ADC) is used to convert them to digital and discrete values.
The values are set and varied using Potentiometer which is present on each sensor. These digital values are displayed on the 2x16 LCD screen. ESP-8266 Wi-Fi module is used to give microcontroller access to Wi-Fi network i.e., it gives connection between the hardware and software. When we supply AC using adapter, Arduino and Wi-Fi module turn on. There is a trigger button which when pressed pushes the values to the cloud. Software part is designed using Microsoft Visual Studio Ultimate 2010. We have used NET framework for the GUI. There is a dropdown menu where we select “monitoring”. We get directed to another page.
When the “start monitoring” is clicked, the values displayed on the LCD is shown here. If the values are not in the specified range, an email is sent to the concerned authority in PDF format. If no action is taken even after a stipulated amount of time, these details are posted on the simulated social networking site which we have created for this purpose.
We have taken an example of five samplesnamely tap water, RO water, muddy water, salty water and soapy water and tested each of them individually with our device in order to show the drastic change in the values of parameters. But in reality we have checked for 25 different samples of water.
In case of first sample, we observed that the pH was less than the normal range (6.5-8.5), conductivity was below normal range(500-1000) and turbidity was more than the specified range(1-5). Hence, this water is not suitable for drinking. In case of second sample, we observed that the pH, conductivity and turbidity were in the normal range specified for drinking. So, this water is fit for drinking purpose. In case of third sample, we observed that the pH was more than the normal range (6.5-8.5), conductivity was way above the normal range(500-1000) and turbidity was more than the specified range(1-5).
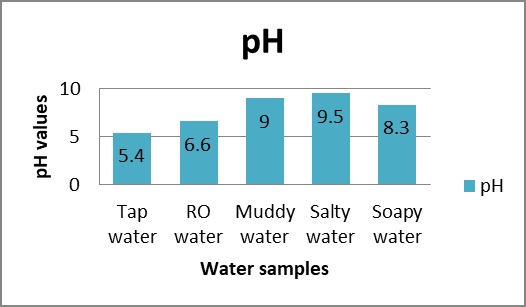
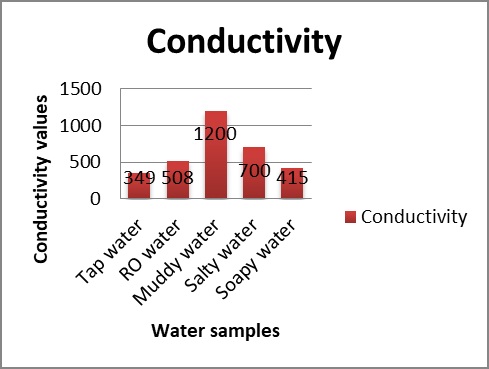
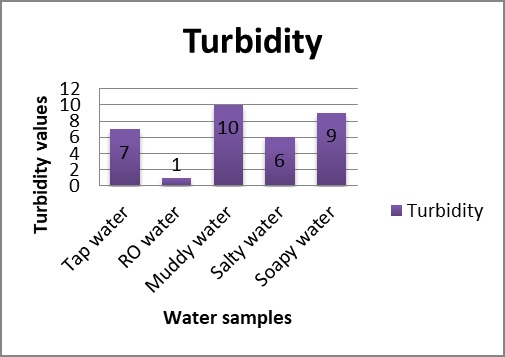
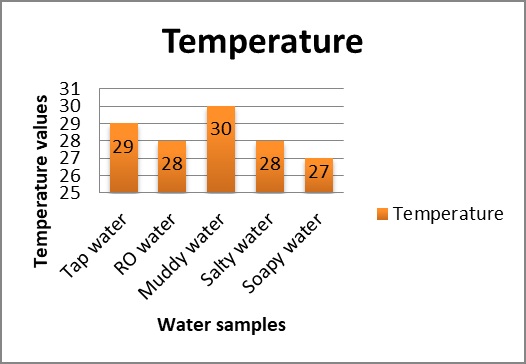
Hence, this water is not suitable for drinking. In case of fourth sample, we observed that the pH was above the normal range (6.5-8.5), conductivity was within the normal range(500-1000) and turbidity was slightly more than the specified range(1-5). Hence, this water is not that suitable for drinking. In case of fifth sample, we observed that the pH was more than the normal range (6.5-8.5), conductivity was below the normal range(500-1000) and turbidity was more than the specified range(1-5). Hence, this water is not suitable for drinking.
We have implemented the testing of water with respect to a few parameters. As future work this could be implemented for other parameters as well like dissolved oxygen, amount of nitrate, phosphate or even chlorine. This could be of great help to the water department as well. This method reduces a lot of laboratory work, expenses and even time. There are sensors available in the market to detect phosphate, nitrate, chlorine etc and this can be made use of to test the quality of water. It can also be modified to test harmful chemicals in drinking water as we all know there a lot of people and animals suffering from diseases passed on by water polluted by chemicals. It can also be used to check bacterial growth in water. As the system is easily portable, it can be taken to the place where the water needs to be tested. Another enhancement that can be done to our system is sending push notifications to mobiles of the factory owners that is saved in the database of the water department i.e., along with the email, a certain notification can be sent to the phone so that he/she won’t be able to ignore the email that was sent to him/her.
In everyday life we interact with hundreds of “expert systems”: bank systems, computer systems, automobile systems, etc. We give full, almost blind trust to these expert systems, but the trust comes inherently with risk – that the system may not function, or that it functions well but not to our benefit. As our water resources become more limited and their quality being impaired, the risk to human health and well-being increases. Science and technology are valuable and essential resources for responding to the challenges of ensuring sustainable and secure water (Blockstein and Brunette 2008). But ultimately, improving water quality will require an engaged public that is concerned, willing to invest resources and act to protect the environment. This means ordinary citizens must move from not knowing or caring about local water conditions to a personal knowledge about their ground and surface waters, sources of pollution and what actions are necessary to counteract or reverse harmful trends and reinforce positive ones.
[1] Blockstein, D.E. &Brunette, D.L. (2008) Environmental Research and Education Needs. National Council for Science and the Environment, Washington D.C.
[2] Converse, J.M. (1976-1977). Predicting “No Opinion” in the Polls. Public Opinion Quarterly,Vol. 40, pp.515-530.
[3] Dillman, D.A. (2000). Mail and Internet Surveys, 2nd ed. Wiley, New York, USA.
[4] Faulkenberry, G.D. & Mason, R. (1978). Characteristics of Nonopinion and No Opinion Response Groups. Public Opinion Quarterly, Vol. 42, pp.533-543.
