


Published on Apr 02, 2024
The purpose of this experiment is two fold: the first part is designed to determine the origin of the color of a soda pop. In the second part you will determine by how much a sample of grape soda has been diluted. Be specific, which soda are you measuring?
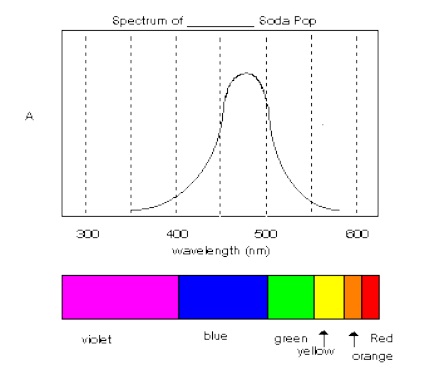
The spectrum of a soda pop is obtained by measuring the absorbance of a sample of the pop at different wavelengths using a spectrophotometer. This spectrum can then be related to the color of the pop. Next a calibration curve is prepared by measuring the absorbance of different dilutions of grape soda at a single wavelength. The absorbance of the unknown solution can then be measured at the same wavelength and compared to the calibration curve to determine its concentration.
The spectrum of a soda pop is obtained by measuring the absorbance of a sample of the pop at different wavelengths using a spectrophotometer. This spectrum can then be related to the color of the pop. Next a calibration curve is prepared by measuring the absorbance of different dilutions of grape soda at a single wavelength. The absorbance of the unknown solution can then be measured at the same wavelength and compared to the calibration curve to determine its concentration.
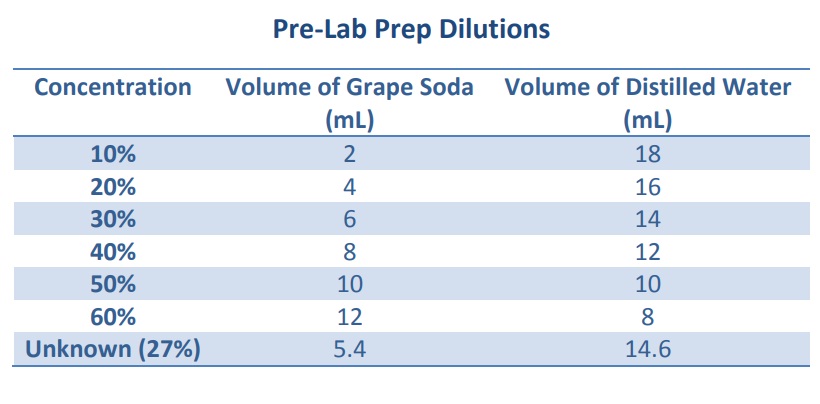
Sample Preparation: Pour about 15-20 ml of pop into a beaker and stir to remove the carbonation. Dilute it to 50% by pouring 10 ml into a graduated cylinder and add an equal volume of water. Stir. (Any waste in this experiment can be poured down the drain).
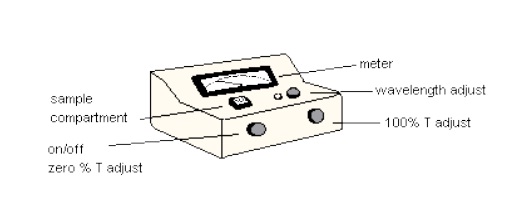
1. Be sure the spectrophotometer is turned on.
2. Set the wavelength knob to 600 nm.
3. Using the zero adjust knob on the left side, set the needle to read 0% transmittance (%T) on the display. [Nothing should be in the sample compartment].
4. Fill one cuvette with distilled water and insert it in the sample compartment with the line facing the front. Close the top.
5. Use the 100% adjust knob on the right hand side to adjust the display to 100%T with the water-containing cuvette in the holder. Change the mode to absorbance. The reading for absorbance with the blank (water cuvette) should be 0.00. Remove the water cuvette and set it aside without emptying it.
6. Fill the other cuvette with your soda solution you prepared.
7. Insert the soda cuvette in the instrument and close the cover. Record the absorbance of the solution of soda pop and the wavelength you are measuring. Be sure to indicate which sample you are using.
8. Remove the cuvette, close the top and change the wavelength to a setting that is 20 nm lower.
9. Insert the cuvette of distilled water and reset the 0.00 A.
10. Replace the water cuvette with your sample-containing cuvette and read the absorbance, again recording your results.
11. Repeat steps 8 through 11 until you reach 360 nm.
1. Set the spectrophotometer wavelength to 500 nm.
2. Set the zero and 100%T as above. Change the mode to absorbance.
3. Measure the absorbance of each of the four standard solutions of grape soda provided.
4. Record the absorbance and the solution concentration (in percent) in your notebook.
5. Measure and record the absorbance of your unknown grape soda solution.
1. Plot the visible spectrum of the soda on graph paper. Your graph should fill the entire page and use accurate markings. All graphs should contain a title and appropriate labels on the axes. Include a diagram indicating the wavelength regions and the corresponding colors of visible light. Use this diagram and plot to explain the origin of the color of the soda in your conclusion.
2. Next make a plot of the absorbance (“y” axis) of the different standard grape pop solutions versus their concentrations (“x” axis), where the four points indicate the measurements of the four known concentrations. Use a ruler to draw the “best” straight line through as many points as possible. This line is generally called a trend line. Your graph should have contain equally spaced divisions, the trend line through the points, and the title at the top.
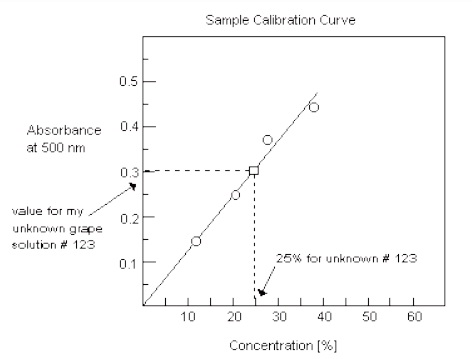
3. Now you can use this calibration plot to determine the concentration of your unknown grape pop solution. Prepare a cuvette with an unknown solution and find its absorbance with the Spec 20. Find the concentration of your unknown by determining where its absorbance crosses the calibration line on your graph.
Follow the line straight down from this point and read the concentration for the unknown from the “x” axis (% concentration). Report your value in your conclusions--along with your unknown number.
1. M. Philip, Advanced Chemistry (Physical and Industrial) Published in South Asia by Foundation Books New Delhi (2003) p. 168.
2. Chris Knud-Hansen, Conflict Research Consortium (1994).
