


Published on Nov 30, 2023
Biometric technologies are defined as automated methods of identifying or authenticating the identity of a living person based on unique physiological or behavioral characteristics. Biometrics can provide very secure and convenient authentication for an individual since they cannot be stolen or forgotten and are very difficult to forge.
• A physiological characteristic is a relatively stable physical characteristic, such as an individual's fingerprint, hand geometry, iris pattern, or blood vessel pattern on the back of the eye. This type of biometric measurement is usually unchanging and unalterable without significant duress to the individual.
• A behavioral characteristic is more a reflection of an individual's psychological makeup. A signature is the most common behavioral biometric used for identification. Because most behavioral characteristics vary over time, an identification system using these must allow updates to enrolled biometric references.
A key factor in the selection of the appropriate biometric technology is its accuracy. Biometric accuracy is the system's ability of separating legitimate matches from imposters. When the live biometric template is compared to the stored biometric template, a matching score is used to confirm or deny the identity of the user. System designers set this numeric score to accommodate the desired level of accuracy for the system, as measured by the False Acceptance Rate (FAR) and False Rejection Rate (FRR).
. False Rejection Rate (FRR) refers to the statistical probability that the biometric system is not able to verify the legitimate claimed identity of an enrolled person, or fails to identify an enrolled person.
. False Acceptance Rate (FAR) refers to the statistical probability of False Acceptance or incorrect verification. In the most common context, both False Rejection and False Acceptance represent a security hazard.
If a mismatching pair of fingerprints is accepted as a match, it is called a false accept. On the other hand, if a matching pair of fingerprints is rejected by the system, it is called a false reject. The error rates are a function of the threshold. Often the interplay between the two errors is presented by plotting FAR against FRR with the decision threshold as the free variable. This plot is called the ROC (Receiver Operating Characteristic) curve.
The two errors are complementary in the sense that if one makes an effort to lower one of the errors by varying the threshold, the other error rate automatically increases. In a biometric authentication system, the relative false accept and false reject rates can be set by choosing a particular operating point (i.e., a detection threshold). Very low (close to zero) error rates for both errors ( FAR and FRR ) at the same time are not possible.
By setting a high threshold, the FAR error can be close to zero, and similarly by setting a significantly low threshold, the FRR rate can be close to zero. A meaningful operating point for the threshold is decided based on the application requirements, and the FAR versus FRR error rates at that operating point may be quite different. To provide high security, biometric systems operate at a low FAR instead of the commonly recommended equal error rate ( EER ) operating point where FAR=FRR .
Fingerprints are a distinctive feature and remain invariant over the lifetime of a subject, except for cuts and bruises. As the first step in the authentication process, a fingerprint impression is acquired, typically using an inkless scanner. Several such scanning technologies are available. Figure 5A shows a fingerprint obtained with a scanner using an optical sensor. A typical scanner digitizes the fingerprint impression at 500 dots per inch (dpi) with 256 gray levels per pixel. The digital image of the fingerprint includes several unique features in terms of ridge bifurcations and ridge endings, collectively referred to as minutiae.
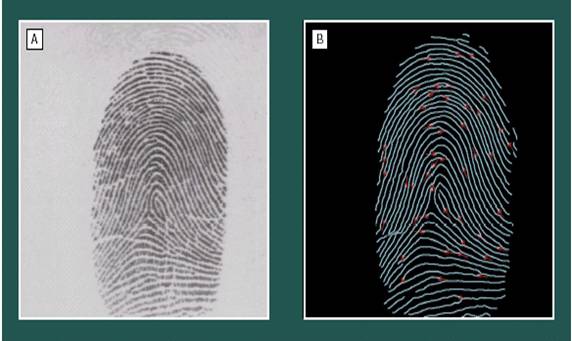
The next step is to locate these features in the fingerprint image, as shown in Figure 5B, using an automatic feature extraction algorithm. Each feature is commonly represented by its location (x,y) and the ridge direction at that location (θ). However, due to sensor noise and other variability in the imaging process, the feature extraction stage may miss some minutiae and may generate spurious minutiae. Further, due to the elasticity of the human skin, the relationship between minutiae may be randomly distorted from one impression to the next. In the final stage, the matcher subsystem attempts to arrive at a degree of similarity between the two sets of features after compensating for the rotation, translation, and scale.
This similarity is often expressed as a score. Based on this score, a final decision of match or no-match is made. A decision threshold is first selected. If the score is below the threshold, the fingerprints are determined not to match; if the score is above the threshold, a correct match is declared. Often the score is simply a count of the number of the minutiae that are in correspondence. In a number of countries, 12 to 16 correspondences (performed by a human expert) are considered legally binding evidence of identity.
The operational issues in an automated fingerprint identification system (AFIS) are somewhat different from those in a more traditional password-based system. First, there is a system performance issue known as the “fail to enroll” rate to be considered. Some people have very faint fingerprints, or no fingers at all, which makes the system unusable for them. A related issue is a “Reject” option in the system based on input image quality. A poor quality input is not accepted by the system during enrollment and authentication.
Note that non-cooperative users, improper usage, dirt on the finger can cause poor quality inputs, or bad input scanners. This has no analog in a password system. Then there is the fact that in a biometric system the matching decision is not clear-cut. A password system always provides a correct response—if the passwords match, it grants access but otherwise refuses access. However, in a biometric system, the overall accuracy depends on the quality of input and enrollment data along with the basic characteristics of the underlying feature extraction and matching algorithm
A fingerprint is composed of valley and ridge lines. They follow a pattern. The general shape of this pattern may be classified according to 5 classes. The second set of features of a fingerprint are cores and deltas. The core is located by a square while the delta is located by a triangle as shown in figure 5.2.
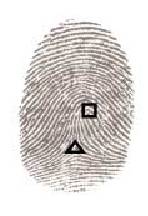
Figure 5.2 shows core by squares and delta by a triangle
The AFIS allows a classification using more than one criteria versus a search based only on a single fingerprint pattern, reducing the number of fingerprints inspected. The pattern classification divides all fingerprint templates into five sets. Interestingly, the distribution of fingerprints in these 5 classes is not homogeneous among all people:
• Left loop class represents 34% of the total number of fingerprints
• Right loop class represents 31% of the total number of fingerprints
• Whorl class represents 27 % of the total number of fingerprints
• Arch class represents 4% of the total number of fingerprints
| Are you interested in this topic.Then mail to us immediately to get the full report.
email :- contactv2@gmail.com |
